
Explore the prevalence and severity of stunting through childhood for our Younger Cohort individuals (born in 2001-02):
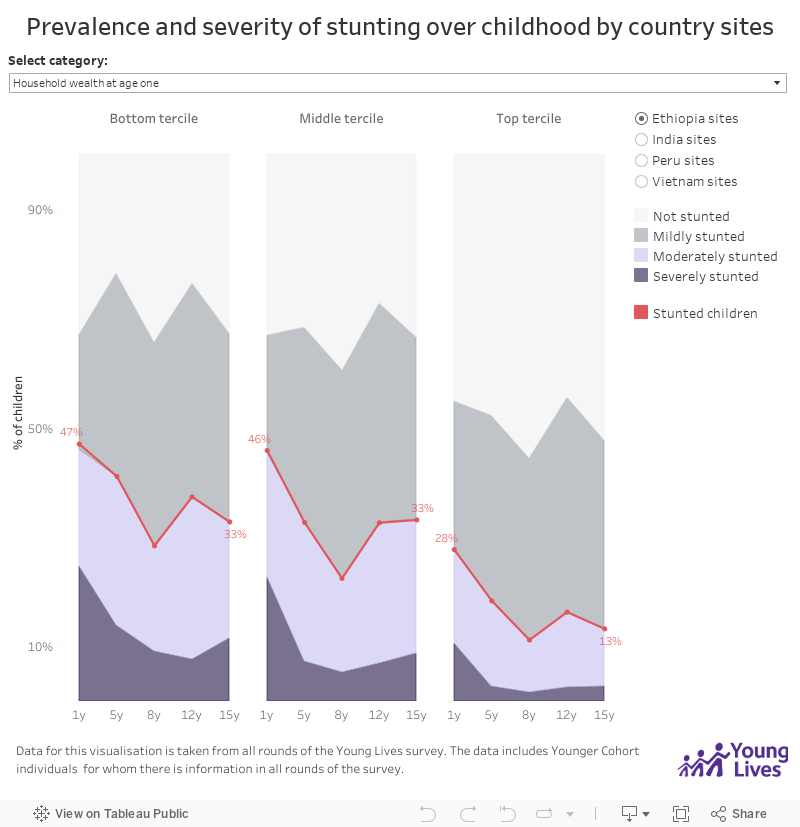
This visualisation shows the percentage of children in Young Lives who are stunted from early childhood to mid-adolescence. The area chart shows the incidence of stunting by severity. The line is the percentage of children who are stunted at each age. The visualisation can be filtered to compare stunting prevalence across countries, or to compare the prevalence of stunting within each country by child sex, or location and household wealth in 2002. For more information on how we define ‘mildly’, ‘moderately’ and ‘severely’ stunted, please find our data dictionary below.
| Label | Description |
| Location | Household's location in round 5 (2016) survey. The sentinel sites and communities that households were sampled from in 2016 were defined as urban or rural, based on administrative definitions in each country. |
| Household wealth | Household's wealth in round 5 (2016) survey computed using the Young Lives Wealth Index disaggregated into terciles (top, middle, bottom). The Young Lives Wealth Index is a composite index measuring households' access to services such as water and sanitation, their ownership of consumer durables such as refrigerators, and the quality of floor, roof, and wall materials in their dwelling. Households in each cohort of the Young Lives survey were categorised into terciles based on their wealth index in 2002, with the households with lowest wealth belonging to the bottom tercile, and those with the highest wealth belonging to the top tercile. |
| Activity |
Studying: Average hours spent at school/college/university (including all time spent, not only attending hours, and travelling time, out and return), studying at home, and extra tuition outside the home. Working (paid): Average hours spent doing activities for pay or for money outside of household or for someone not in the household. Working (unpaid): Average hours spent doing tasks on family farm, cattle herding (household and/or community), other family business, shepherding, piecework or handicrafts done at home (not just farming). Doing domestic tasks (including caring for others): Average hours spent doing domestic tasks (fetching water, firewood, cleaning, cooking, washing, and shopping) and caring for others (younger children or ill households members). Playing: Average hours spent on leisure (playing, seeing frineds, using the internet, etc.) Sleeping: Average hours spent sleeping. |
Explore the prevalence and severity of stunting through childhood for our Younger Cohort individuals (born in 2001-02):
This visualisation shows the percentage of children in Young Lives who are stunted from early childhood to mid-adolescence. The area chart shows the incidence of stunting by severity. The line is the percentage of children who are stunted at each age. The visualisation can be filtered to compare stunting prevalence across countries, or to compare the prevalence of stunting within each country by child sex, or location and household wealth in 2002. For more information on how we define ‘mildly’, ‘moderately’ and ‘severely’ stunted, please find our data dictionary below.
| Label | Description |
| Location | Household's location in round 5 (2016) survey. The sentinel sites and communities that households were sampled from in 2016 were defined as urban or rural, based on administrative definitions in each country. |
| Household wealth | Household's wealth in round 5 (2016) survey computed using the Young Lives Wealth Index disaggregated into terciles (top, middle, bottom). The Young Lives Wealth Index is a composite index measuring households' access to services such as water and sanitation, their ownership of consumer durables such as refrigerators, and the quality of floor, roof, and wall materials in their dwelling. Households in each cohort of the Young Lives survey were categorised into terciles based on their wealth index in 2002, with the households with lowest wealth belonging to the bottom tercile, and those with the highest wealth belonging to the top tercile. |
| Activity |
Studying: Average hours spent at school/college/university (including all time spent, not only attending hours, and travelling time, out and return), studying at home, and extra tuition outside the home. Working (paid): Average hours spent doing activities for pay or for money outside of household or for someone not in the household. Working (unpaid): Average hours spent doing tasks on family farm, cattle herding (household and/or community), other family business, shepherding, piecework or handicrafts done at home (not just farming). Doing domestic tasks (including caring for others): Average hours spent doing domestic tasks (fetching water, firewood, cleaning, cooking, washing, and shopping) and caring for others (younger children or ill households members). Playing: Average hours spent on leisure (playing, seeing frineds, using the internet, etc.) Sleeping: Average hours spent sleeping. |