
In 2016, more than 20 per cent of the world’s under-5 year olds (155 million children overall) were stunted, or too short compared to healthy peers of the same age and gender. The share of stunting is disproportionately spread – more than half of stunted children lived in Asia, and more than a third in Africa. Though international attention has mostly focused on stunting among children under age five, for whom it represents threats to their cognitive and later physical development (Campbell et al. 2014; Black et al. 2013; Grantham-McGregor et al. 2007; IFPRI 2016), stunting remains a challenge through the life course, and disproportionately affects more disadvantaged children, with the burden varying by age, gender, and the environments to which children are exposed.
Young Lives data uniquely enables us to understand patterns of stunting in some of the countries most affected.
Prevalence and severity of stunting over childhood by country sites
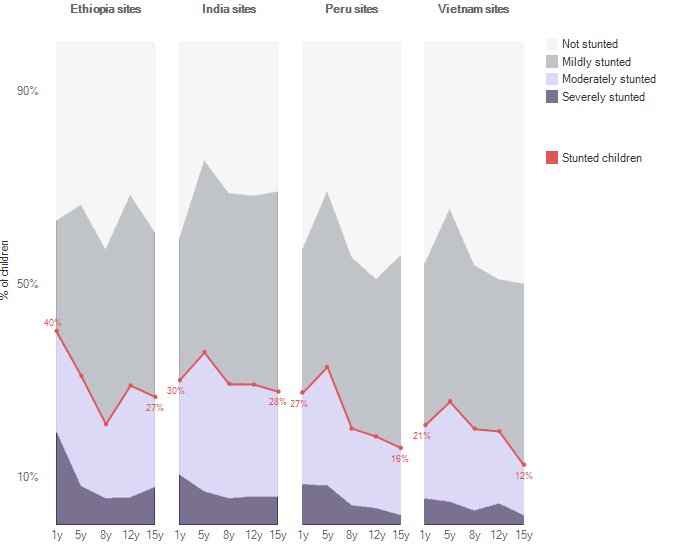
This visualization compares the prevalence and severity of stunting at different ages in the four Young Lives countries. The percentage of children who were stunted (as depicted by the red line) at age one only gives an incomplete picture of stunting. This percentage varies as children grow so that, although Ethiopia had the highest share of children who were stunted at age one, this is no longer the case by age fifteen. The degree of severity of stunting (darker shades indicate more severe stunting) also varies - close to half of children stunted at age one were severely stunted in Ethiopia (compared to a quarter of stunted children being severely stunted in Vietnam) but this proportion had fallen to a third by age fifteen.
Gaps in stunting prevalence over childhood
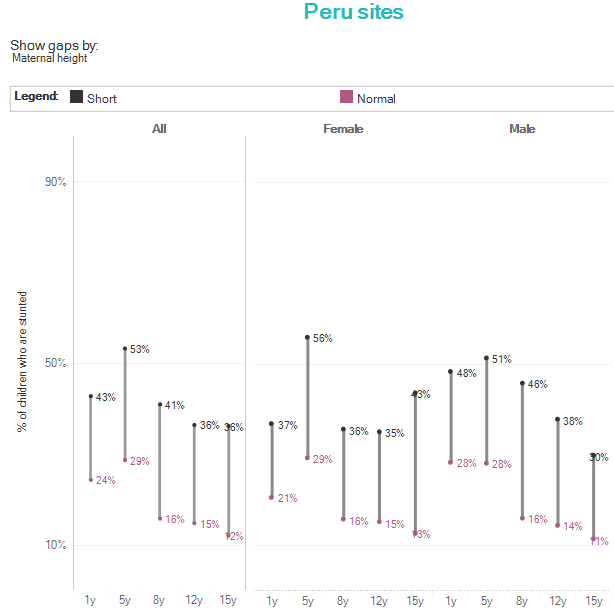
The interactive elements of this visualization and the following also enable us to compare how the prevalence and severity of stunting varies between ages one and fifteen by gender, and by location and household wealth at age one. Children in rural areas, and from poorer households are much more likely to be stunted throughout childhood, as material disadvantage and low levels of access to services contribute to poorer nutritional intake and higher likelihood of poorer health, making stunting more likely (Georgiadis et al. 2017; Nolan 2016).
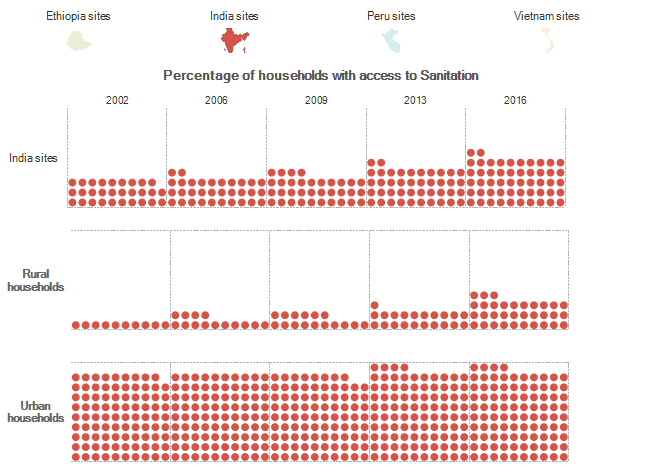
Children living in rural areas are often poorer and more economically vulnerable to shocks such as natural disasters, and furthermore also have lower levels of access to water and sanitation, which are associated with healthy physical and cognitive development (Dearden, Schott, et al. 2017; Dearden, Brennan, et al. 2017; Georgiadis et al. 2017. This visualization depicts the percentage of children (each circle is one percentage point) who live in households with access to improved water and sanitation. Though access to these services has generally improved over time in both rural and urban areas, rural areas still had far lower levels of access to these services compared to urban areas.
Changes in dietary diversity between 2006 and 2016
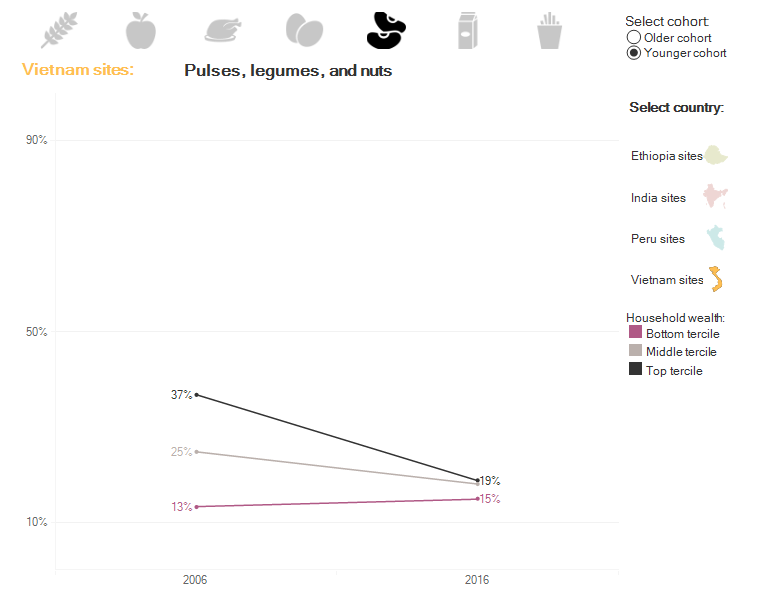
Children’s growth depends on the quality and quantity of their nutritional intake. Young Lives measures dietary diversity in children as an indicator of the quality of their nutritional intake. These visualizations both depict changes in dietary diversity over time. Though dietary diversity has generally increased or remained stable among the children and young people in the Young Lives samples, changes in diets have been reflected in increased consumption of animal source foods and sugars in some contexts (Aurino, Fernandes, and Penny 2016).
Stunting trajectories over childhood
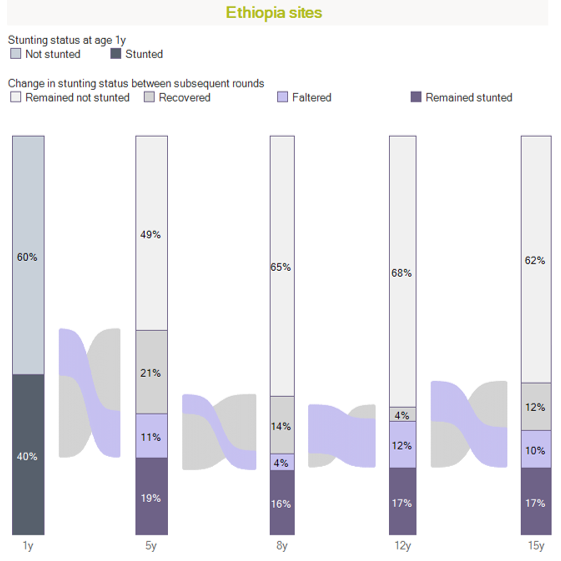
The final visualization in this series demonstrates how stunting varies over the life course of children. Though initial nutritional status as indicated by stunting is an important determinant of children’s later growth (Georgiadis et al. 2016) there is significant movement during each interval between survey rounds, as children recover from stunting, and falter to become stunted at all ages between one and fifteen (Georgiadis 2017; Lundeen et al. 2014; Watkins et al. 2017; Georgiadis et al. 2017; Crookston et al. 2013). Both growth faltering and recovery from initial stunting may occur beyond the critical period of early childhood, and the extent to which this occurs once again depends on children’s characteristics, as well as the quality of their diets and living environments. Therefore, interventions to improve children’s nutrient intake (such as through school feeding) and to reduce poverty, may be effective in reducing stunting through childhood and adolescence (Singh, Park, and Dercon 2014; Porter and Goyal 2016; Georgiadis and Penny 2017; Dornan and Georgiadis 2015).
In 2016, more than 20 per cent of the world’s under-5 year olds (155 million children overall) were stunted, or too short compared to healthy peers of the same age and gender. The share of stunting is disproportionately spread – more than half of stunted children lived in Asia, and more than a third in Africa. Though international attention has mostly focused on stunting among children under age five, for whom it represents threats to their cognitive and later physical development (Campbell et al. 2014; Black et al. 2013; Grantham-McGregor et al. 2007; IFPRI 2016), stunting remains a challenge through the life course, and disproportionately affects more disadvantaged children, with the burden varying by age, gender, and the environments to which children are exposed.
Young Lives data uniquely enables us to understand patterns of stunting in some of the countries most affected.
Prevalence and severity of stunting over childhood by country sites
This visualization compares the prevalence and severity of stunting at different ages in the four Young Lives countries. The percentage of children who were stunted (as depicted by the red line) at age one only gives an incomplete picture of stunting. This percentage varies as children grow so that, although Ethiopia had the highest share of children who were stunted at age one, this is no longer the case by age fifteen. The degree of severity of stunting (darker shades indicate more severe stunting) also varies - close to half of children stunted at age one were severely stunted in Ethiopia (compared to a quarter of stunted children being severely stunted in Vietnam) but this proportion had fallen to a third by age fifteen.
Gaps in stunting prevalence over childhood
The interactive elements of this visualization and the following also enable us to compare how the prevalence and severity of stunting varies between ages one and fifteen by gender, and by location and household wealth at age one. Children in rural areas, and from poorer households are much more likely to be stunted throughout childhood, as material disadvantage and low levels of access to services contribute to poorer nutritional intake and higher likelihood of poorer health, making stunting more likely (Georgiadis et al. 2017; Nolan 2016).
Children living in rural areas are often poorer and more economically vulnerable to shocks such as natural disasters, and furthermore also have lower levels of access to water and sanitation, which are associated with healthy physical and cognitive development (Dearden, Schott, et al. 2017; Dearden, Brennan, et al. 2017; Georgiadis et al. 2017. This visualization depicts the percentage of children (each circle is one percentage point) who live in households with access to improved water and sanitation. Though access to these services has generally improved over time in both rural and urban areas, rural areas still had far lower levels of access to these services compared to urban areas.
Changes in dietary diversity between 2006 and 2016
Children’s growth depends on the quality and quantity of their nutritional intake. Young Lives measures dietary diversity in children as an indicator of the quality of their nutritional intake. These visualizations both depict changes in dietary diversity over time. Though dietary diversity has generally increased or remained stable among the children and young people in the Young Lives samples, changes in diets have been reflected in increased consumption of animal source foods and sugars in some contexts (Aurino, Fernandes, and Penny 2016).
Stunting trajectories over childhood
The final visualization in this series demonstrates how stunting varies over the life course of children. Though initial nutritional status as indicated by stunting is an important determinant of children’s later growth (Georgiadis et al. 2016) there is significant movement during each interval between survey rounds, as children recover from stunting, and falter to become stunted at all ages between one and fifteen (Georgiadis 2017; Lundeen et al. 2014; Watkins et al. 2017; Georgiadis et al. 2017; Crookston et al. 2013). Both growth faltering and recovery from initial stunting may occur beyond the critical period of early childhood, and the extent to which this occurs once again depends on children’s characteristics, as well as the quality of their diets and living environments. Therefore, interventions to improve children’s nutrient intake (such as through school feeding) and to reduce poverty, may be effective in reducing stunting through childhood and adolescence (Singh, Park, and Dercon 2014; Porter and Goyal 2016; Georgiadis and Penny 2017; Dornan and Georgiadis 2015).